Monitoring Application Metrics With Nutanix Karbon
The easy way
Overview
When you start running applications in your freshly deployed Karbon Kubernetes cluster, a requirement comes up very quickly: how-to implement monitoring ? Fortunately, Karbon includes everything required to do this cleanly.
When you deploy a new Kubernetes Cluster with Karbon, Prometheus Operator is installed by default and a Prometheus instance is also deployed and configured to monitor your Kubernetes cluster resources.
In this post, I will provide you an overview and a step-by-step setup guide to configure your Karbon Cluster in order to monitor both the cluster itself and your own applications and present this through a unified interface using Grafana.
What is Nutanix Karbon

Karbon is Nutanix’s enterprise Kubernetes managed solution that enables turnkey provisioning, operations, and lifecycle management of Kubernetes.
Get a production-ready Kubernetes Cluster up and running in 20 minutes. Then keep it running smoothly with built-in storage, centralized monitoring, and automated upgrades.
Unlike other Kubernetes solutions, Karbon integrates seamlessly with the entire Nutanix cloud-native stack, and dramatically simplifies Kubernetes without vendor lock-in. For Nutanix customers, Karbon is included in all AOS software editions.
What is Prometheus Operator
In Kubernetes, Operator is a term used to describe a class of software that helps automate the operation of another software . A Kubernetes Operator is typically designed to manage all the operational aspects surrounding the lifecycle of an application from initial configuration and deployment to updates and patches, scaling or just using it.
All of these can be integrated into Kubernetes constructs and invoked as needed. The idea is that by using Kubernetes operators, human involvement in the operation of an application can be reduced to a strict minimum or removed entirely.
The Prometheus Operator makes running Prometheus on top of Kubernetes in a scalable, automated and elegant way as easy as possible, while preserving Kubernetes-native configuration options.

The Prometheus Operator provides the following features:
- Create/Destroy: Easily launch a Prometheus instance for your Kubernetes namespace, a specific application or team using the Operator.
- Simple Configuration: Configure the fundamentals of Prometheus like versions, persistence, retention policies, and replicas from a native Kubernetes resource.
- Target Services via Labels: Automatically generate monitoring target configurations based on familiar Kubernetes label queries; no need to learn a Prometheus specific configuration language.
What is Prometheus
Prometheus is an open-source monitoring system with a dimensional data model, flexible query language, efficient time series database and modern alerting approach.

Prometheus joined the Cloud Native Computing Foundation in 2016 as the second graduated project, after Kubernetes.
This is the defacto choice for metrics monitoring in a Kubernetes environment.
What is Grafana
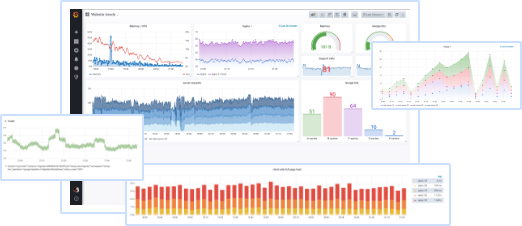
Grafana is the open source analytics and monitoring solution for all your metrics and for every database.

Grafana allows you to query, visualize, alert on and understand your metrics no matter where they are stored. Create, explore, and share dashboards with your team and foster a data driven culture.
Presentation
Architecture
As we already have a first instance of Prometheus deployed and dedicated to the monitoring of the Kubernetes cluster, we are going to deploy a second one specifically for monitoring our applications.
A single instance of Grafana will also be deployed to offer a unified view of the two Prometheus instances.

So we’ll have two Prometheus groups which will monitor different resources:
- One Prometheus server (deployed by default by the Karbon installer) is going to monitor the Kubernetes internal components and state.
- Another Prometheus server is going to monitor any other applications deployed in your cluster.
We will, of course, be able to increase the number of instances independently in each of these groups in order to bring resilience if necessary.
Kubernetes resources
The Prometheus Operator create some Custom Resource Definitions inside your Kubernetes cluster.
In this post we will use the following resources:
Prometheus, which defines a desired Prometheus deployment. The Operator ensures at all times that a deployment matching the resource definition is running.ServiceMonitor, which declaratively specifies how groups of services should be monitored. The Operator automatically generates Prometheus scrape configuration based on the definition.
Setup Guide
In order to complete the following steps, it is necessary to have installed the kubeconfig file of the cluster you want to configure.

You also need a working LoadBalancer service, you can follow this post to deploy MetalLB.
Kubernetes Prometheus Instance
Starting with Karbon v2.2.2 this step is no more necessary. So if you have created your K8s cluster with a Karbon version above v2.2.2 or you have upgraded your K8s cluster after the Karbon v2.2.2 install, you can skip this paragraph.
First we need to reconfigure the existing Prometheus instance in order to restrict the ServiceMonitors it will use.
For this, we’re going to use the Kubernetes labels and we’re going to tell Prometheus to only use the ServiceMonitors that are in a namespace with the following label monitoring=k8s
Applications Prometheus Instance
The next step is to deploy the new dedicated Prometheus instance that will monitor the application metrics.
For this, we will first create a namespace, a service account and some specific RBAC rules to let the Prometheus instance collect metrics on the applications.
The above RBAC rules will have to be adapted according to the security needs of your cluster.
So let’s apply it => kubectl apply -f karbon-app-mon-step2-rbac.yml
Then we are going to create a new Prometheus resource to let the Prometheus Operator deploy a new instance.
So let’s apply it =>kubectl apply -f karbon-app-mon-step2-prom.yml
If we look more closely at the resource definition, we can see that:
- We will use all ServiceMonitors with a
monitoring=appslabel. - We reuse the existing alertmanager.
- We store data for 15 days
- We create a persistent volume of 40GB on the default storageclass
You can, of course, update the Prometheus ressources based on your needs.
The last step is to create a ServiceMonitor resource that will automatically configure Prometheus to collect metrics of all service with a specific label
So let’s apply it =>kubectl apply -f karbon-app-mon-step2-service-monitor.yml
In this case we will use the monitoring: apps labels to specify that a service need to be monitored, and the metrics will be exposed on the port called http-metrics.
Grafana Dashboard
In order to be able to a build visual dashboard, we will deploy Grafana using the official Helm chart and for that you need the Helm v3 CLI installed on your machine. (Helm install documentation).
Since Grafana version 8.3.3 there is a compatibility issue with old versions of Prometheus (pre-v2.22.0 versions). If you are with a Karbon K8s cluster 1.20 or below , install Grafana in version 8.3.2 and not higher. The recommendation is to upgrade to Karbon k8s 1.21or higher.
We need to create a Helm value response file for Grafana
and next use it with Helm to deploy Grafana
In the output of the script, you will find the Grafana url and login/password required to connect to it.
you can connect on Grafana http://XX.XX.XX.X with admin/XXXXXXXXDeploying a sample app
Now we have a working system, it’s time to deploy a sample app and demonstrate how we can automatically integrate with the new application monitoring system.
This is a basic application who expose Prometheus ready metrics on port 8080.
So let’s deploy it =>kubectl apply -f karbon-app-mon-step4-app.yml
Now you can open Grafana’s interface and you will find two Data Sources already configured:
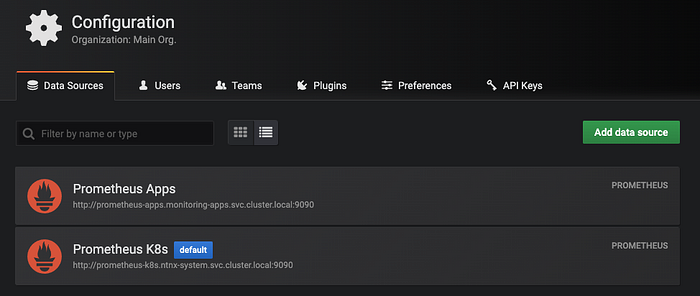
- Prometheus K8s: the built-in Prometheus instance with the system Metrics
- Prometheus Apps: the freshly deployed Prometheus instance with your applications metrics
When creating a new panel, just select the Prometheus Apps Data Sources and you will be able to browse in the applications metrics drop-down list to build your graph.

What’s Next
In this post you’ve seen how simple it is , by using the integrated Prometheus Operator, to monitor your own applications metrics.
Now it is time to unleash the power of Grafana and Prometheus by building your own complex dashboard.
Thanks for reading!
Update
05/30/2020 - Starting Karbon v2.0.2 and k8s 1.16 support we update the Prometheus Operator to v0.33.0, with this new version i have modified the Prometheus resources accordingly (karbon-app-mon-step2-prom.yml) to support the new securityContext.
07/21/2020 - Modify Prometheus resource version to match with the one provided with the system => version: v2.11.0.
06/03/2021 - Starting Karbon v2.2.2 we update the deployed Prometheus ressources to target only Nutanix service monitor.
07/12/2022 - Add Grafana warning for Prometheus compatibility issue.